‘Tales from the Asklepieion of Pergamon’ at the Arts Festival – 17 September 2022

Tales from the Asklepieion

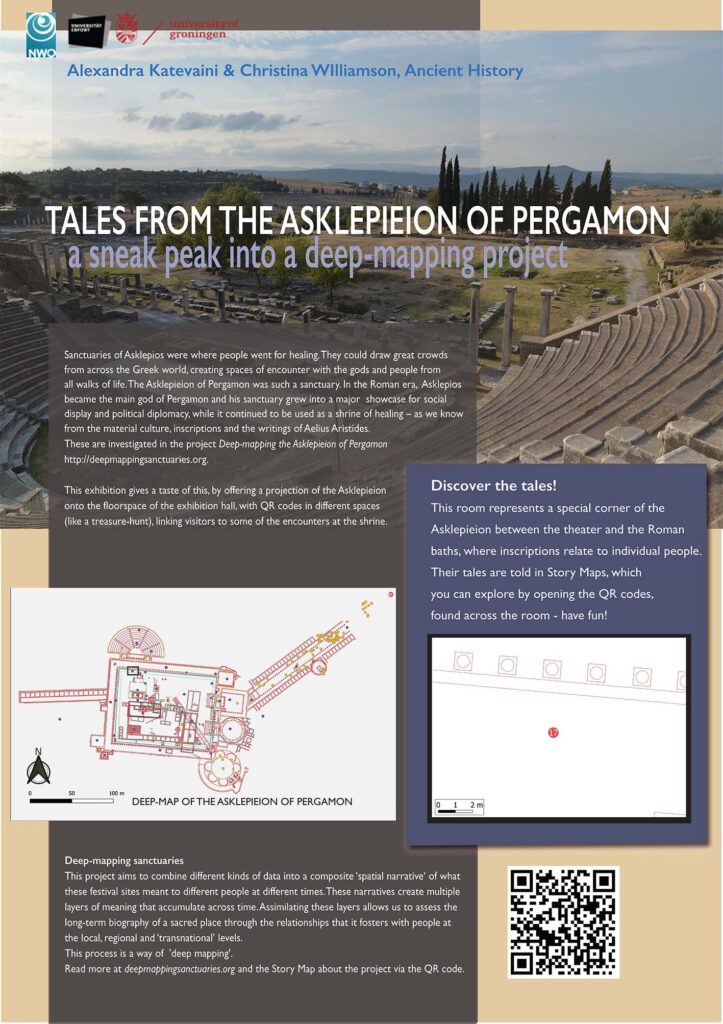
The Arts Festival, on Saturday, 17 September, presented us with a unique opportunity to transform a corner of the University of Groningen into the Asklepieion of Pergamon. The corner was in the Exhibition Hall of the Harmony Building, which houses the Faculty of Arts / Humanities. Ours was one of five projects that interacted with visitors.

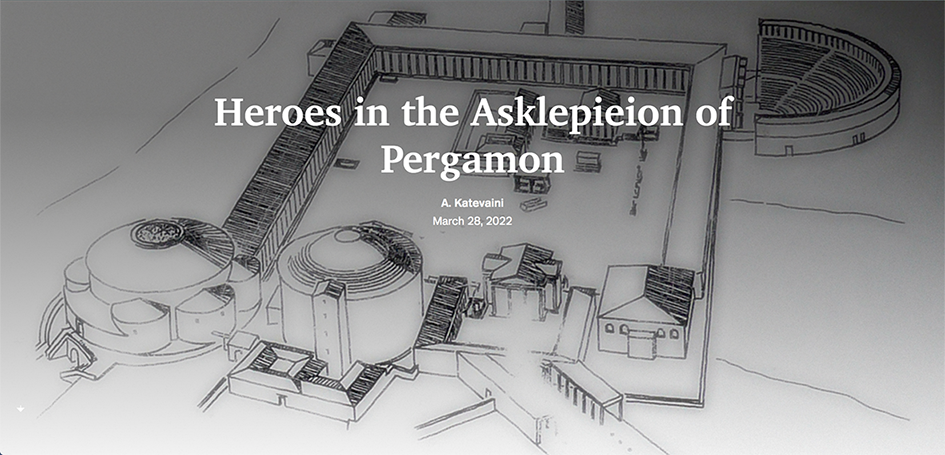
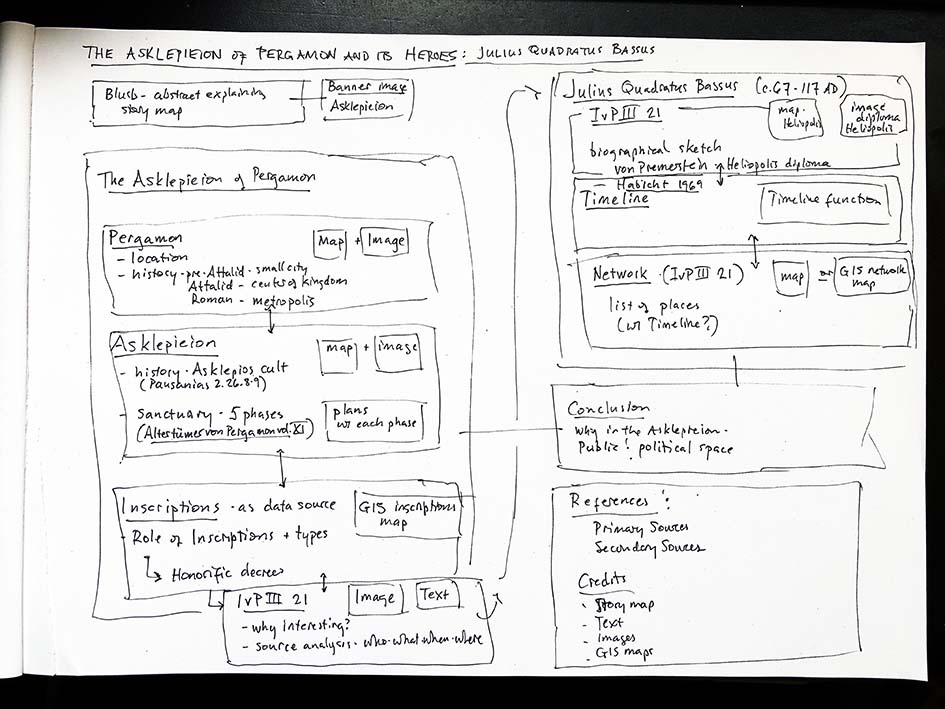
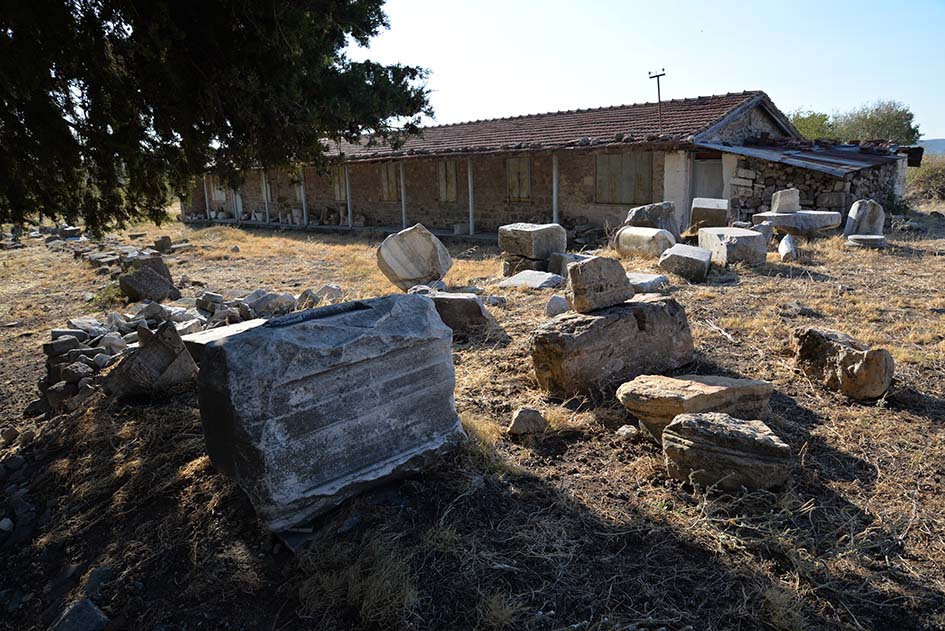
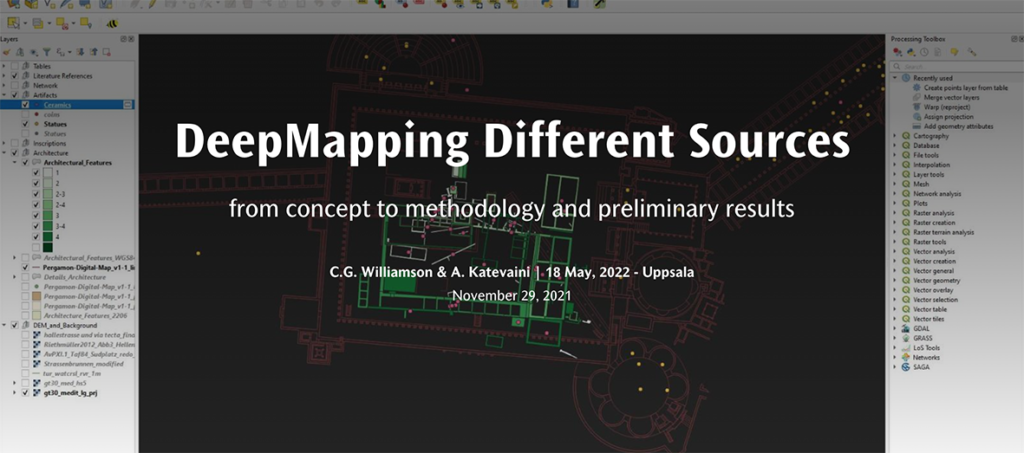
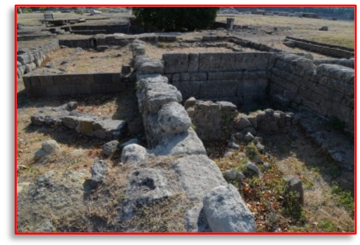
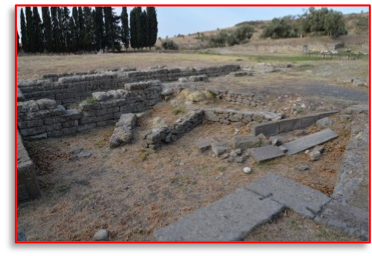
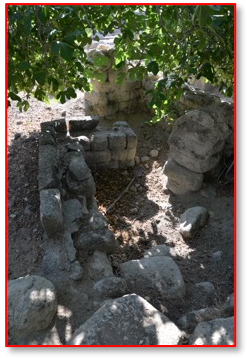
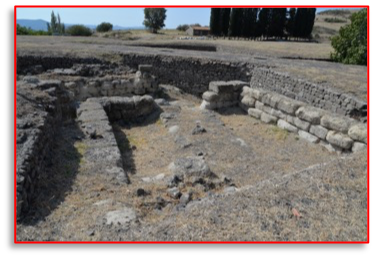
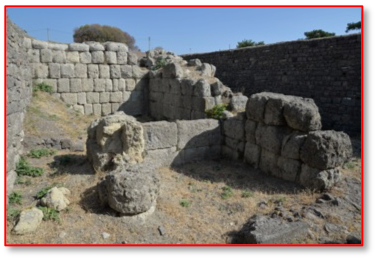
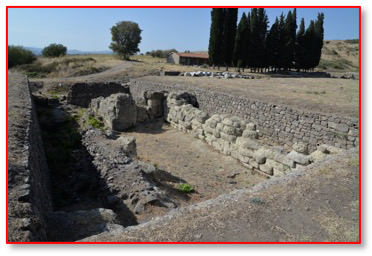
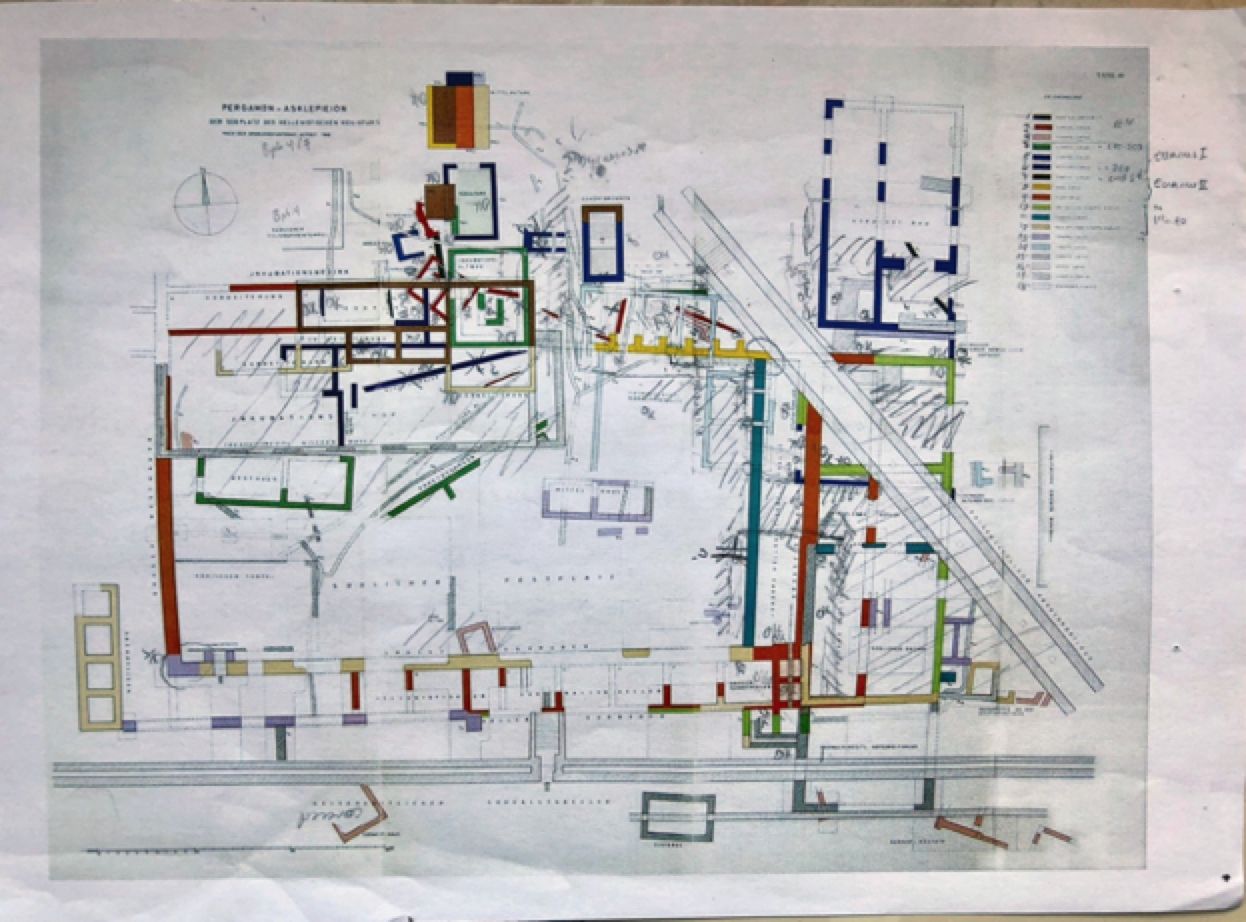
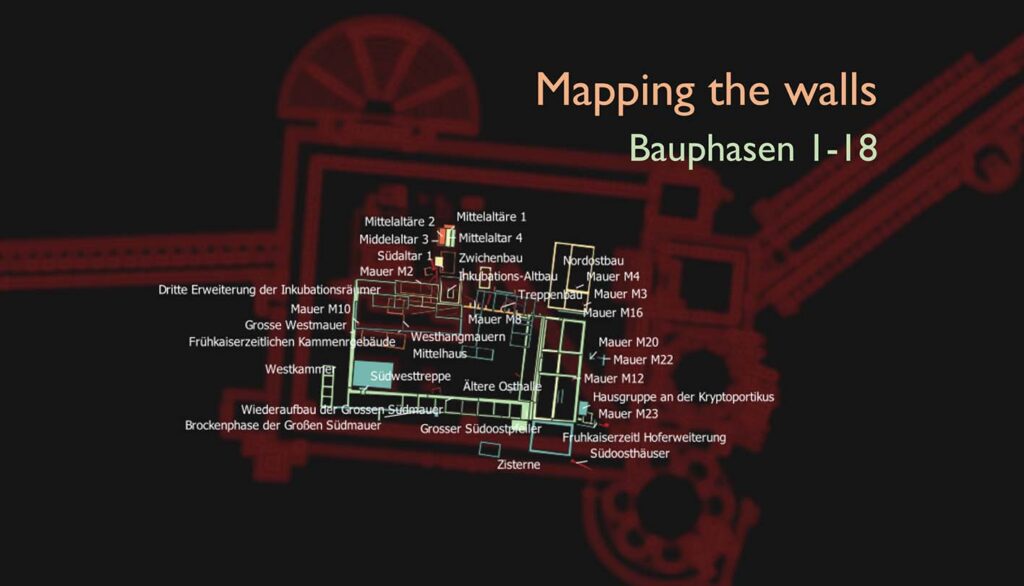
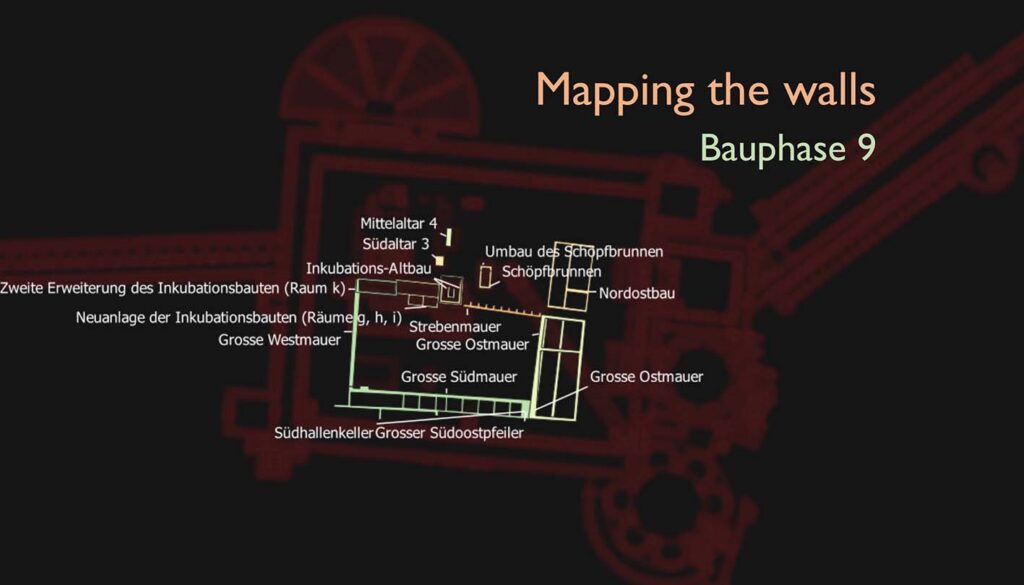
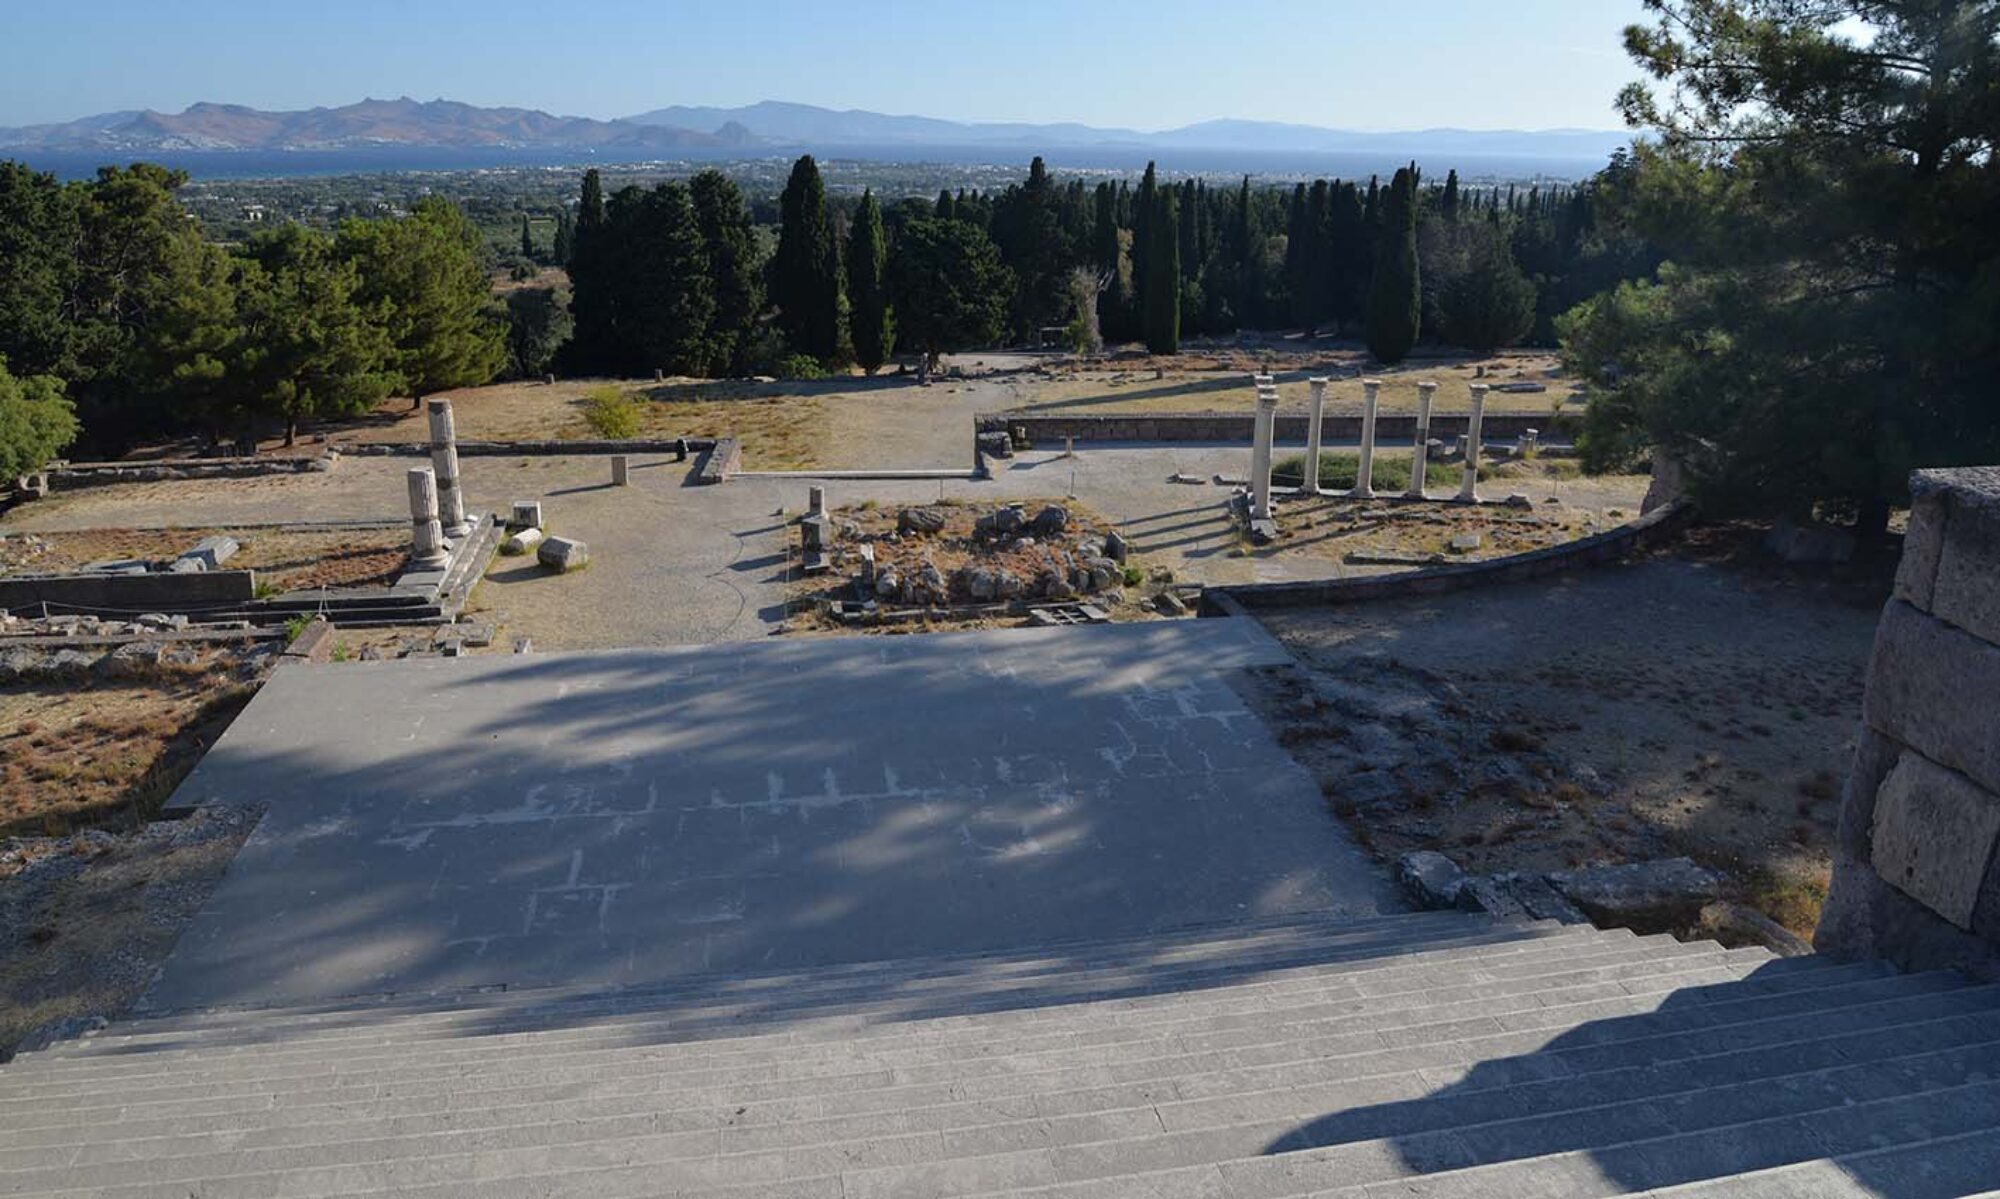
Alexandra Katevaini is the genius behind this project. She had been wanting to find a way for the public in general to engage with our project. The festival provided a perfect venue, but we were a bit late in finding out about it, so we had to act fast! While Christina established contacts and did some of the graphic design, Alexandra set about designing the project in 3D space, creating encounters between visitors of the Arts Festival and ancient visitors at the Asklepieion in Pergamon, through projections and story maps. She selected stories that in our Deep Map are linked to a corner of the Asklepieion in the northwest area, between the Theater, the rocky spring and Roman Baths, and the Felsbarre, or rocky ridge where the oldest temples are located.

Deep-map of the Asklepieion – the black square shows the corner that was the area of our focus for the project.
This is the area of the Asklepieion that we zoomed in on in the presentation, with 17 inscriptions and narratives from Aelius Aristides

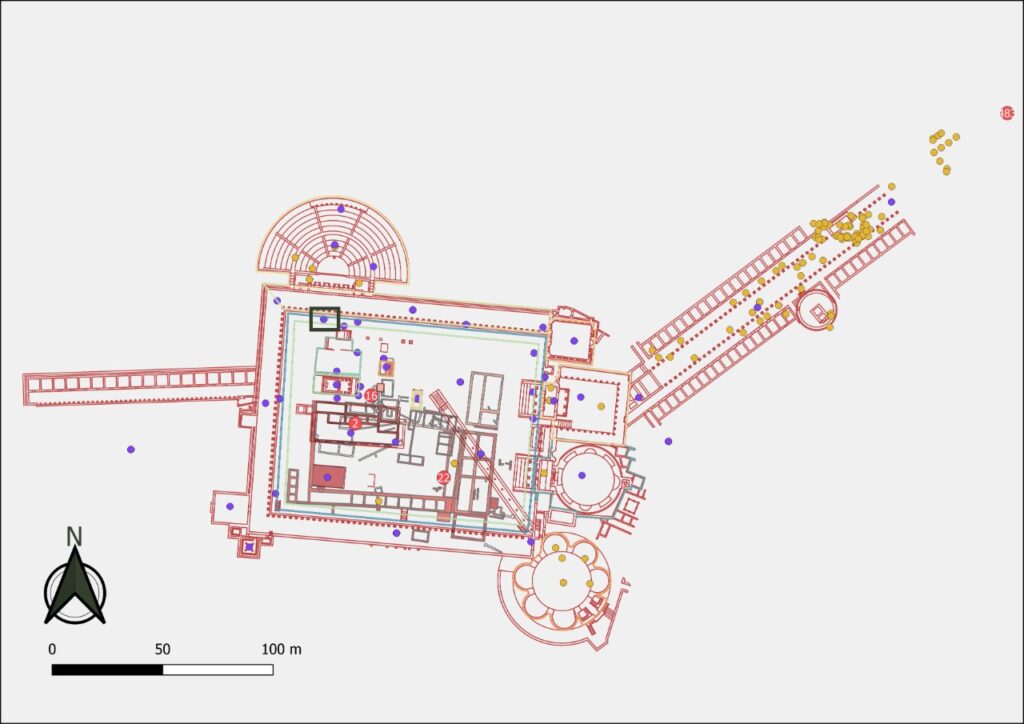
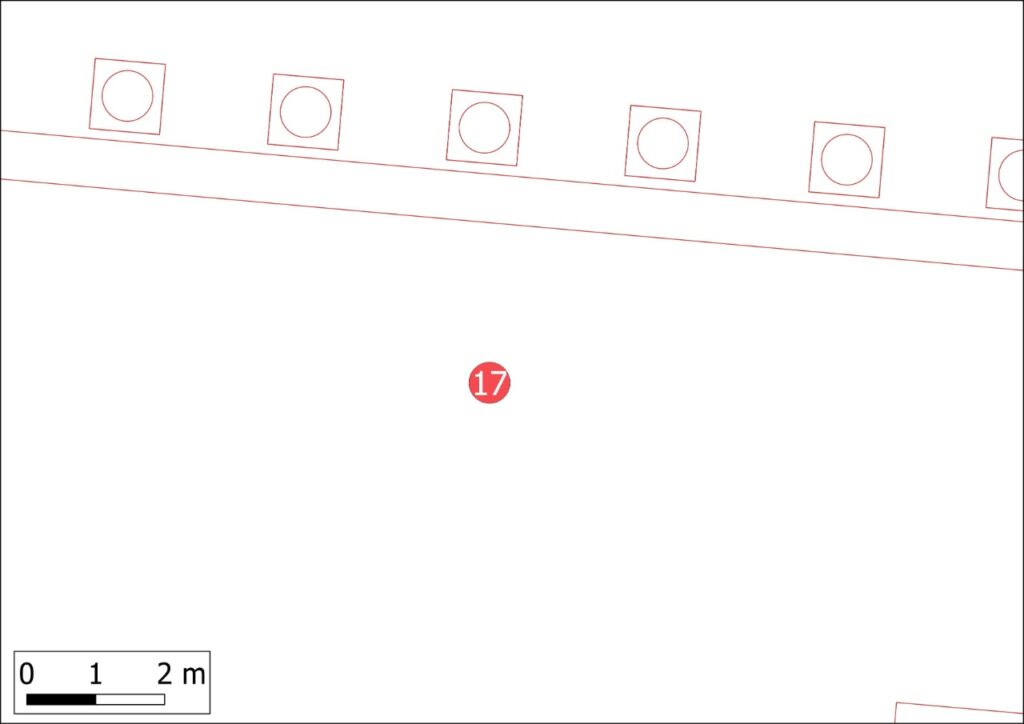
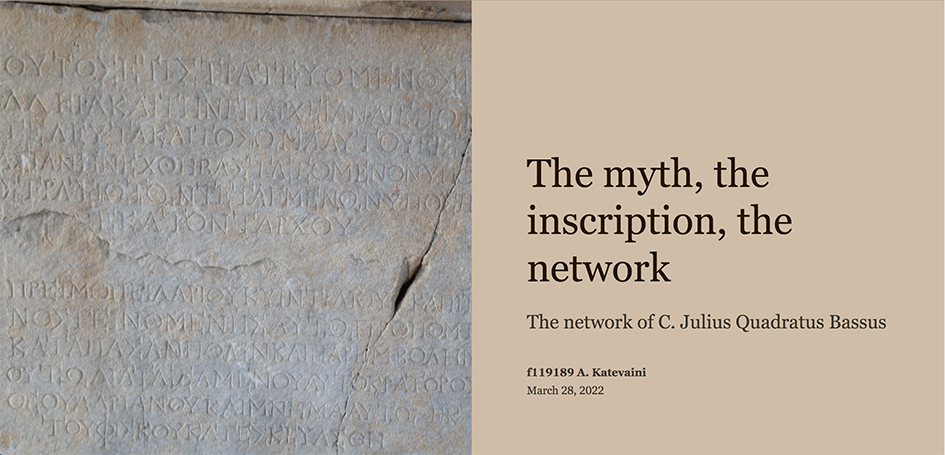
This corner was the scene of some of Aelius Aristides’ activities, and according to the Altertümer von Pergamon (vol. VIII.3 on the inscriptions of the Asklepieion), at least 17 inscriptions, most belonging to honorific statues, were identified as coming from this area. All of these date to the imperial period, but some of the earlier inscriptions were relocated to this area after the massive extension of the sanctuary in the second century AD.
This corner of the shrine had become a true hot spot in the imperial era! In the Exhibition Hall, it became our focal point.

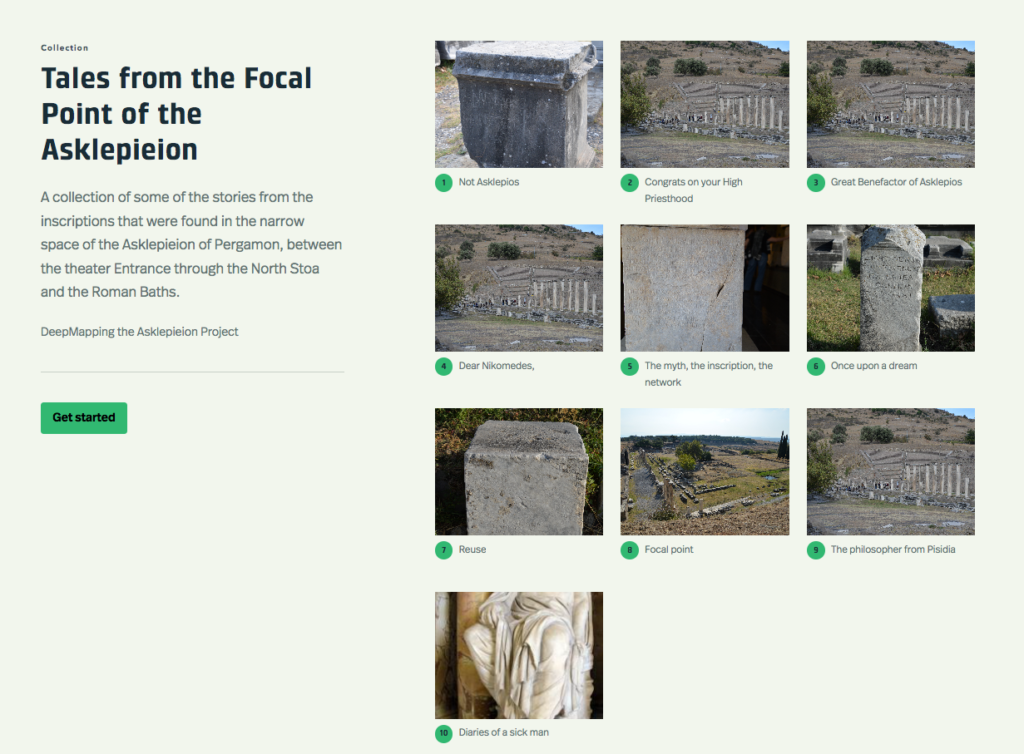
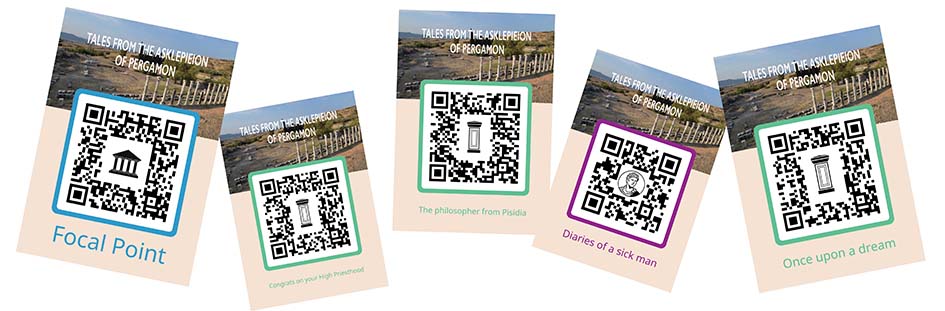
Alexandra then went to work making short stories via Story Maps of the different individuals – in the end she was able to create 10 stories, including one about this area itself. She then generated QR codes with cryptic titles which we printed on cards and taped to different surfaces in the Exhibition Hall – visitors could look for them like Easter eggs. Here are a few examples:…

Samples of the QR cards with individual stories, from the architecture (blue), inscriptions (green), and literary accounts (purple)

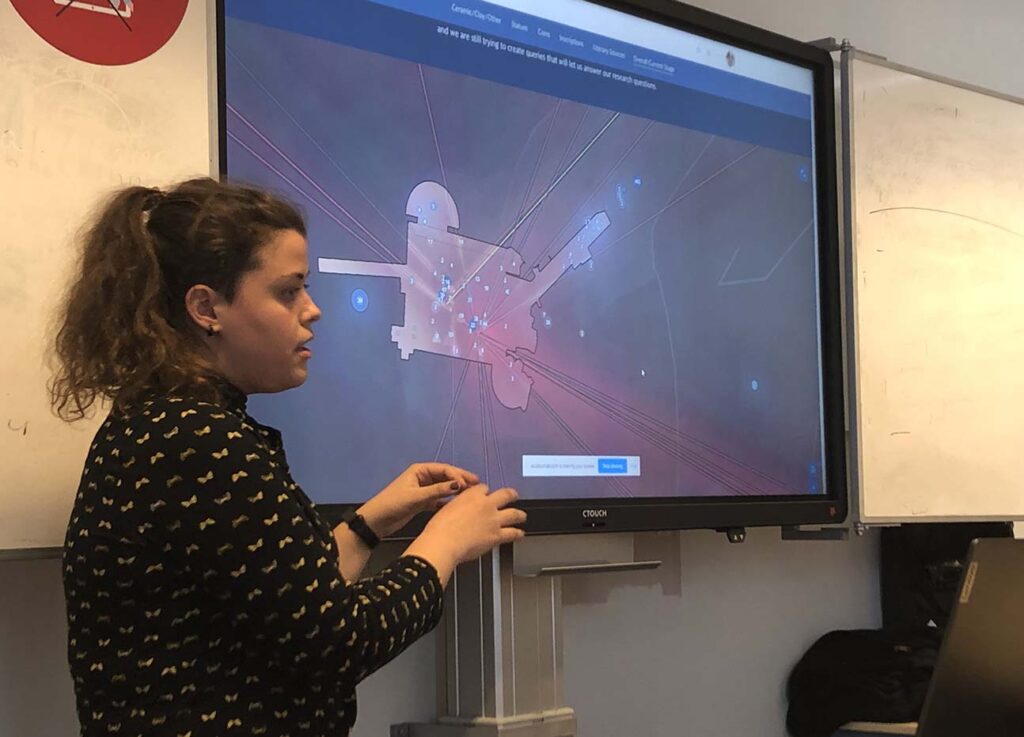
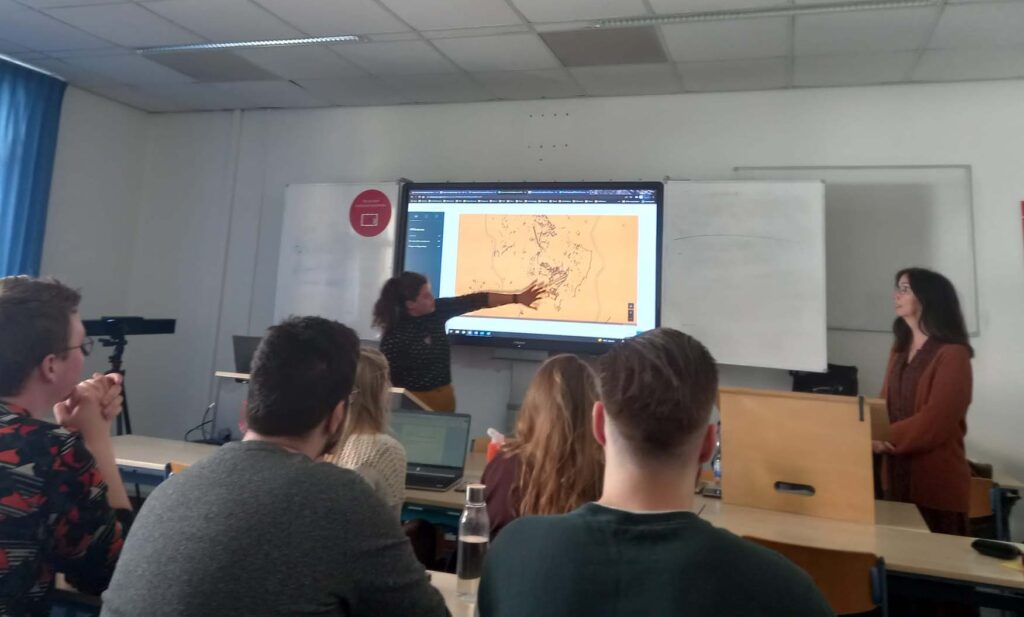
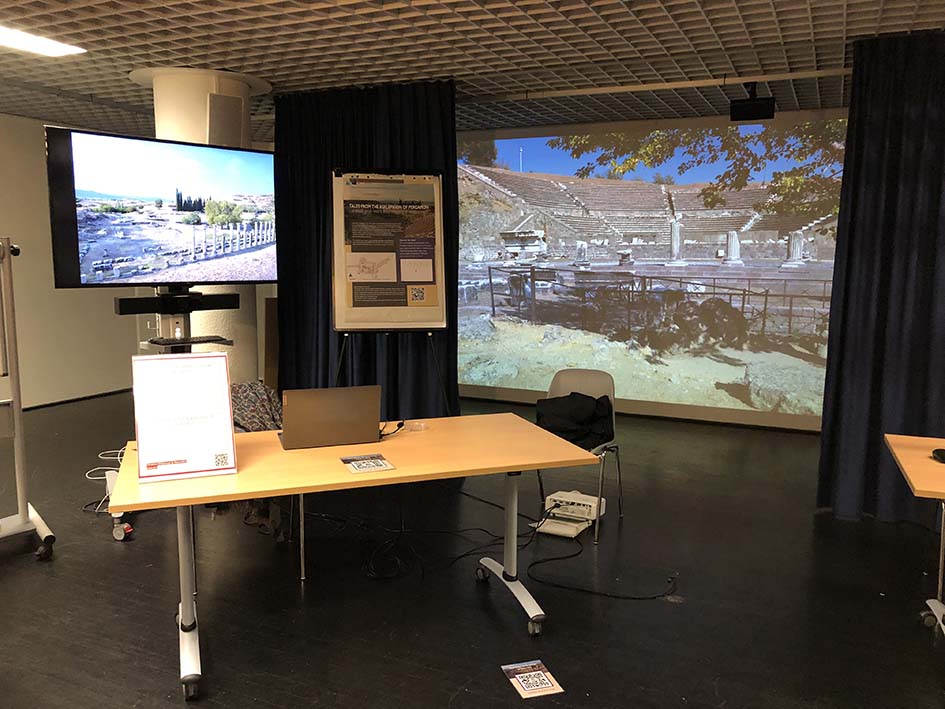
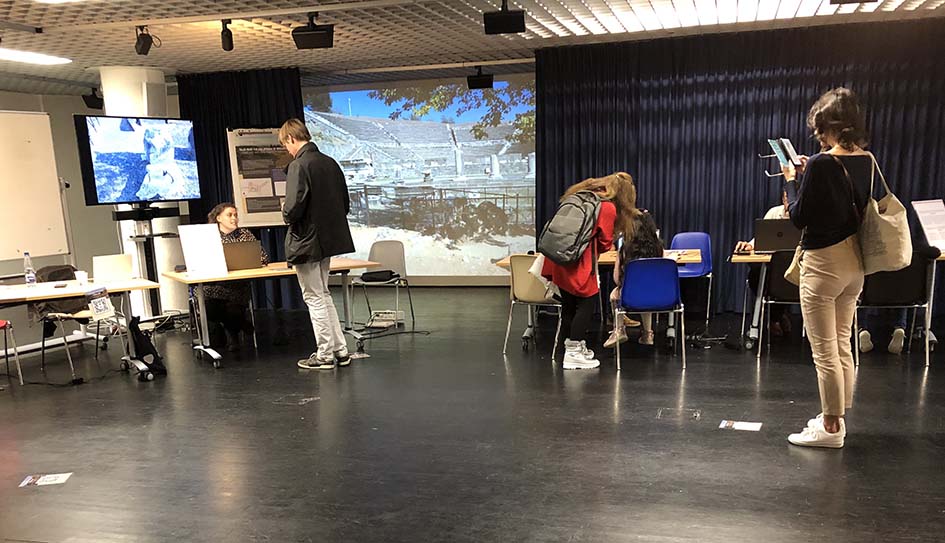
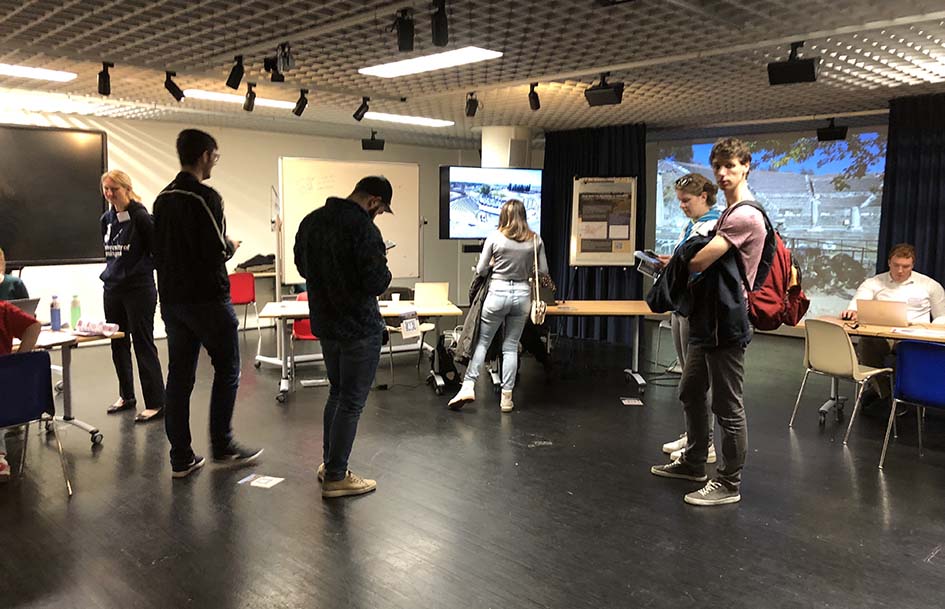
In designing the project, we were hoping to be able to project the plan of this corner onto the floorspace, and scatter the QR-cards in the projected area. But with the means available we were less than impressed by the result. So Plan B went into effect, which was to project a full-scale image from this corner across the wall in the background, with running imagery playing on a large screen behind us. Visitors standing across from us at our table would have had a realistic view of the corner from the shrine, from approximately the very same spot. The QR-cards were then scattered across the Exhibition Hall…

Altogether we were able to tell maybe 30 or 40 people about the project, and most took some time to access some of the stories via the QR codes. Especially considering we had only worked on this for three days ahead of the event, we are very pleased with the result – and consider this as Part I of Tales from the Asklepieion – we plan to add more Tales!

Meanwhile, you can browse the stories so far here…

Story Map collection with the individual stories from the ‘focal point’ in the Asklepieion.

‘Heroes in the Asklepieion’ – workshop for MA class ‘Atelier Living Heritage’ – 25 March 2022

Another opportunity to share the project Deep-mapping the Asklepieion presented itself to us in March, when we were invited to give a lecture for the MA course ‘Atelier Living Heritage’, co-taught by by Dr Margriet Hoogvliet and Prof. Dr Rina Knoeff. Among others, the course deals with new ways of presenting historical research, including the possibilities that digital technologies offer.

We decided to focus on the usage of Story Maps, with a lecture and a workshop, in which we explain what a story map is and how you can use it to communicate spatial narratives (see also Digital Storytelling by ESRI), and then let students try it out with some ready-made data.

The theme – Heroes in the Asklepieion

Our focus was on the honorific monuments in the Asklepieion of Pergamon. Alexandra Katevaini created a base story map, Heroes in the Asklepieion, which briefly presents the Asklepieion, then introduces the inscriptions at the sanctuary, focusing on the honorific decrees for the elite, both local and foreign, and focusing on people with strong ties to Rome. Most of these decrees were inscribed on bases that originally included statues of the person being honored, turning the sanctuary into a kind of ‘Hall of Fame’ that immortalized both the individual dignitaries and the relation between Pergamon and Rome.

Story map ‘Heroes in the Asklepieion’

The assignment for the students was to create a story map of one of the ‘heroes’ that could later be linked to the base ‘Heroes’ story map. This hero was Julius Quadratus Bassus, descendant of the Attalids, elite of Pergamon, and member of the Roma Senate, and honored in the Asklepieion via the inscription IvP III 21.

The mini-workshop – building a story map

start with a story board

We started with a story board, showing students how it is best to plan their story maps in thematic blocks. Once there is an overall structure and flow to the story, then you can start collecting texts, images and other media, especially maps, that will support the main point of each block. Since we only had an hour for our mini-workshop, we prepared texts and images in advance for the students to use, following step-by-step instructions.

First we drew out the story board, and explained how the different sections would become blocks in the story map. Then Christina began to tell the story of Julius Quadratus Bassus, starting with a brief biography, then his family network, a timeline of his activities, then the inscription, and the mapped network that can be drawn out from this inscription. While Christina was explaining these features, Alexandra created a story map on the spot, that students could follow. It was performance art!

After this it was the students’ turn to make their own story maps, following the same steps with the same data. They could try to recreate what Alexandra made, or try different approaches.

Julius Quadratus Bassus – the myth, the inscription, the network

Alexandra’s resulting story map is shown here and is the first in a series of ‘stories’ that we can derive from the inscriptions themselves.

Story map on Julius Quadratus Bassus

To be continued…

This was a great way to start scratching the surface of the thousands of stories that the Asklepieion has to tell. and a good way of communicating it with students.
This was the first time we ‘performed’ a story map, but Alexandra has taught students in a number of other MA courses how to build a story map as part of their course work:

  • MA 2020-21 Power and Cult in the Hellenistic World – story maps were used in lieu of a real excursion to Greece (due to COVID restrictions),
  • MA 2021-2022 Sacred Landscapes in the Post-classical world – story maps were used in support of an excursion assignment ;
  • MA 2022-2023 Urban Timescapes in the Graeco-Roman world – story maps are the final assignment.

But the Julius Quadratus Bassus story is a great kickstart to the series of stories to come…

A word of thanks

We are grateful to Margriet Hoogvliet for giving us this opportunity to share our work with her students. Margriet is also very keen on deep-mapping herself, and has applied some of the concepts in her own projects, which include Broeders 3D, an interactive encounter with the Brethren of the Common Life in Dordrecht, that she developed with Prof. Dr. Sabrina Corbellini and Dr Pieter Boonstra.

Mapping inscriptions at the Asklepieion with help from Zürich

Good news! Since December of 2021 we are working together with the team from the Ancient History section of the Historisches Seminar at the University of Zürich. Under the direction of Prof. Dr. Andreas Victor Walser, and with Dr Ursula Kunnert, this team is tracking the inscriptions of Pergamon in the context of their project ‘Inschriften von Pergamon’. Their project aims to re-examine the inscriptions of Pergamon published by Max Fränkel in 1890 and 1895 (Alterümer von Pergamon VIII. 1-2), but also those from the Asklepieion that were published by Christian Habicht in 1969 (Alterümer von Pergamon VIII. 3). The project also compiles ‘new’ inscriptions that have only provisionally been published, or not yet at all. This exciting project will result in a new publication within the series Alterümer von Pergamon that promises to deliver many new insights that will surely lead us to rethink some of our interpretations of the Asklepieion as well as Pergamon in general.

The depot south of the Asklepieion, where several of the inscriptions are stored

Part of the project included a careful inventory of the current location of the inscriptions, and both Prof. Walser and Dr Kunnert have kindly and generously shared the results of many long hours in the sun and careful location and identification of the inscriptions, across the landscape of ancient Pergamon and modern Bergama.

We are grateful to be able to include this level of detail in our deep map of the Asklepieion. This new modern layer of location has sparked some discussion on the mobility of monuments, both in ancient times, as some of extant inscriptions seem to have been moved to the North stoa of the imperial shrine, which seems to have functioned as a Hall of Fame, as well as in modern times, as some inscriptions are placed more or less near their original locations, others are kept farther away – some on site, some in the museum. We found ourselves asking who (across the ages) decides which inscriptions are seen, which are stored away?

These are important questions in considering the narrative function of a deep map!

Read more about the Zürich project here:
https://www.hist.uzh.ch/de/fachbereiche/altegeschichte/lehrstuehle/walser/forschung/pergamon.html

Deep-mapping in Mainz and Uppsala – November 2021 and May 2022

The presentations of our approach have led to updated versions of our story map, in which we discuss our approach towards deep-mapping, and how we apply that to the sanctuary of Asklepios in Pergamon.

On 29 November 2021, we were invited by Dr Matthias Grawehr to present the project at the Klassische Archäologie / Alte Geschichte / Karpeia of the Johannes Gutenberg University of Mainz. This gave Alexandra the opportunity to go into more detail on the data that we are incorporating as shapefiles in GIS. She created a separate story map Deep-mapping Different Data Sources that addresses her approach and types of data.

The Archaeology and Ancient History department of the University of Uppsala has also been very supportive, and during a short fellowship in the spring we were able to present the project at the Wednesday Seminar via the story map Deep-mapping the Asklepieion of Pergamon.

So the story map has been evolving since we first used it over a year ago, in 2021, until its present state. We see it as an ideal medium for online audiences, and will continue to update it. Story maps are just that, they tell stories through maps, but also through a mixture of media, with the text oftentimes in the supportive role, rather than the other way around.

But fortunately talks and lectures are increasingly in person these days, and for that we feel it more effective to focus on the images and functionality, rather than longish narratives that not everyone can read – at the end we send the audience to the story map through a link that they can access in their own time.


Fieldwork: Tracing walls at the Asklepieion – September 2021

From 25 September to 3 October 2021 I was able to go on a research trip to Bergama in order to examine the Asklepieion in closer detail. The aim of this visit was to identify on the ground the numerous walls and structures that predate the grand imperial shrine of the second century AD (Shown here below, left). Some 18 constructions phases (Bauphasen) were identified in Altertümer von Pergamon XI.1, presented on Table 69 (below, right).

This is the plan that is generally used in discussions of the Hellenistic sanctuary

mapping the walls

In practice, I both superimposed the plan on a satellite image, to roughly detect what could still be seen of the walls of the structures, since much of the surface area of the sanctuary is now covered by soil.

This helped in identifying the visible walls on the spot and connecting this to the different periods of the sanctuary. I also used photos from the excavation publications in Altertümer, which also gave an indication of the erosion that has taken place in the years since excavation – good thing that most of the walls are now covered up again!

Identification of walls and structures in the building phases

More impressions of the walls of the Asklepieion…

The result is a new, annotated working version of Taf. 69 from AvP XI.1, making it much easier for me to visualize the extent of the sanctuary in its landscape in the earlier phases and to understand its development.

AvP XI.1 Taf. 69 – working version

This sheet, and the photos, have helped us untangle the architectural complex, and its intricate chronologies. The excavators were primarily focused on the building history and its sequences, and so their understanding of the architectural development is literally the backbone of the chronology of the Asklepieion, at least in the temenos area, as almost all of the finds from the excavations were linked to the building phases of the walls that they were associated with, even though some individually date to an earlier or later period in time. This makes it all the more important to understand the temporal sequence of these construction phases.

Spreadsheet listing the structures and the building phases and periods in which they were extant.

Based on this list, we can now get an indication of the periodization of the many structures in our GIS deep-map model of the shrine. This will make it much easier to run cross-analyses over time and space. Now we can decide whether we want to view the different periods of the shrine all together (below, left), or focus on a one or two phases (below, right).

The background image in these two figures is based on the Pergamon Digital Map shapefile of the Asklepieion, generously made available by the DAI on the TransPergMikro website.


This trip was made possible through additional support from the German Archaeological Institute (DAI, Abt. Istanbul) and the Transformation of the Pergamon Micro-region Project (TransPergMikro), funded by the DFG (German Research Council), and the DFG-funded Humanities Centre for Advanced Studies (KFG) “Religion and Urbanity: Reciprocal Formations” (FOR 2779) at the Max Weber Centre for Advanced Cultural and Social Studies of the University of Erfurt, Germany.