The presentations of our approach have led to updated versions of our story map, in which we discuss our approach towards deep-mapping, and how we apply that to the sanctuary of Asklepios in Pergamon.
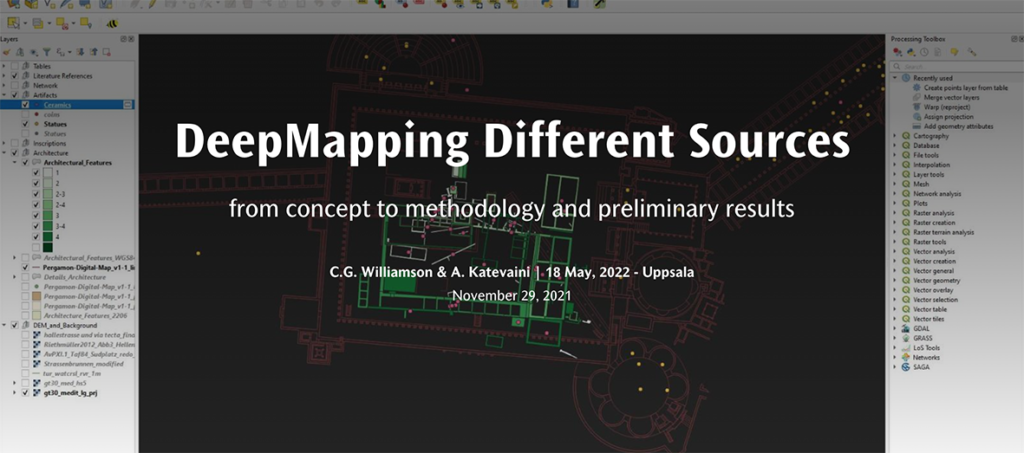
On 29 November 2021, we were invited by Dr Matthias Grawehr to present the project at the Klassische Archäologie / Alte Geschichte / Karpeia of the Johannes Gutenberg University of Mainz. This gave Alexandra the opportunity to go into more detail on the data that we are incorporating as shapefiles in GIS. She created a separate story map Deep-mapping Different Data Sources that addresses her approach and types of data.

The Archaeology and Ancient History department of the University of Uppsala has also been very supportive, and during a short fellowship in the spring we were able to present the project at the Wednesday Seminar via the story map Deep-mapping the Asklepieion of Pergamon.

So the story map has been evolving since we first used it over a year ago, in 2021, until its present state. We see it as an ideal medium for online audiences, and will continue to update it. Story maps are just that, they tell stories through maps, but also through a mixture of media, with the text oftentimes in the supportive role, rather than the other way around.
But fortunately talks and lectures are increasingly in person these days, and for that we feel it more effective to focus on the images and functionality, rather than longish narratives that not everyone can read – at the end we send the audience to the story map through a link that they can access in their own time.
